Inspect the data
9,994 rows and 21 columns. No duplicates. 11 postal codes were missing (all from Burlington), so I filled them with 0 to keep the column numeric.
Why: a quick audit tells you what needs fixing before any analysis.
Which discounts and categories help profit, and which hurt it? I cleaned 9,994 orders with reusable Python classes, explored them, and turned the patterns into recommendations.
9,994 rows and 21 columns. No duplicates. 11 postal codes were missing (all from Burlington), so I filled them with 0 to keep the column numeric.
Why: a quick audit tells you what needs fixing before any analysis.
Converts repeated text columns to the category type, trims text, and flags outliers with the IQR rule: 1,167 in Sales, 1,881 in Profit, 856 in Discount and 170 in Quantity.
Why: a class makes the cleaning reusable on any similar dataset.
Changing 7 text columns to categories cut memory from 8.27 MB to 4.48 MB (a 45.9% reduction) with no loss of data.
Added profit margin, shipping duration in days, and a sales performance label (Low, Medium, High) based on quartiles.
Why: these turn raw columns into things a manager can act on.
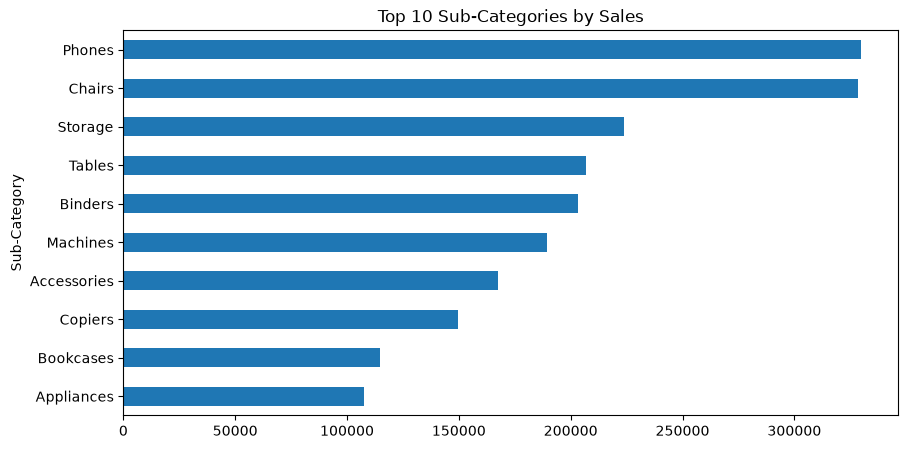
Correlations, distributions, discount analysis, monthly trend, region and sub-category comparisons.
One call returns total sales and profit, average discount and margin, best category and region, shipping time and order count.
Why: stakeholders get the headline numbers without reading code.
class DataCleaner:

    def __init__(self, df):
        self.df = df.copy()

    def convert_to_category(self, cat_columns):
        for col in cat_columns:
            try:
                self.df[col] = self.df[col].astype("category")
            except KeyError:
                print(f"Column '{col}' not found, skipped.")
        return self.df

    def clean_text_columns(self, text_columns):
        for col in text_columns:
            try:
                self.df[col] = self.df[col].astype(str).str.strip()
            except KeyError:
                print(f"Column '{col}' not found, skipped.")
        return self.df

    def detect_outliers_iqr(self, numeric_columns):
        report = {}
        for col in numeric_columns:
            try:
                Q1, Q3 = self.df[col].quantile([0.25, 0.75])
                IQR = Q3 - Q1
                lower, upper = Q1 - 1.5 * IQR, Q3 + 1.5 * IQR
                mask = (self.df[col] < lower) | (self.df[col] > upper)
                report[col] = mask.sum()
            except Exception as e:
                print(f"Error checking '{col}': {e}")
return reporttotal_binders = superstore[superstore["Sub-Category"] == "Binders"].shape[0] high_discount_binders = superstore[(superstore["Sub-Category"] == "Binders") & (superstore["Discount"] >= 0.7)].shape[0] binders_normal_profit = superstore[(superstore["Sub-Category"] == "Binders") & (superstore["Discount"] < 0.7)]["Profit"].sum() binders_high_discount_profit = superstore[(superstore["Sub-Category"] == "Binders") & (superstore["Discount"] >= 0.7)]["Profit"].sum()
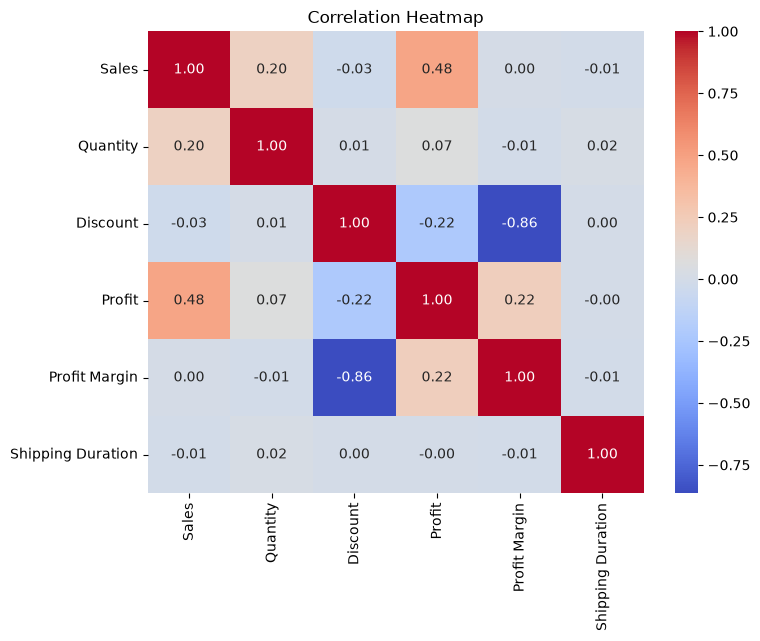
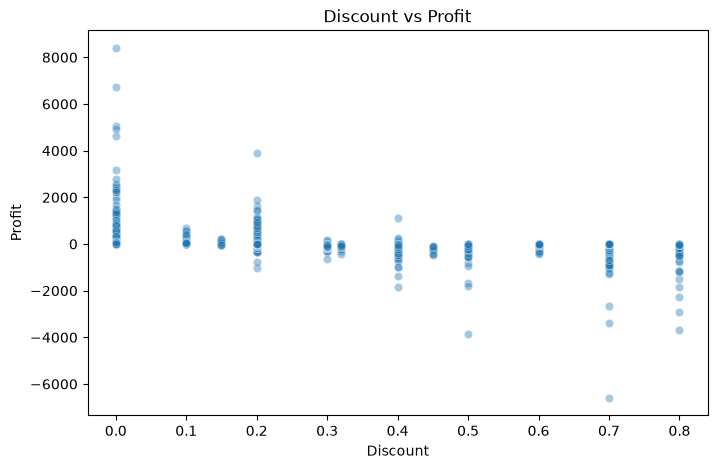
Discount vs profit margin has a −0.86 correlation. Furniture has the highest average discount (17.4%) and the lowest margin (3.9%).
40.2% of Binders orders (613 of 1,523) carry a 70%+ discount. They lose $38,510, against $68,732 earned from normally discounted ones.
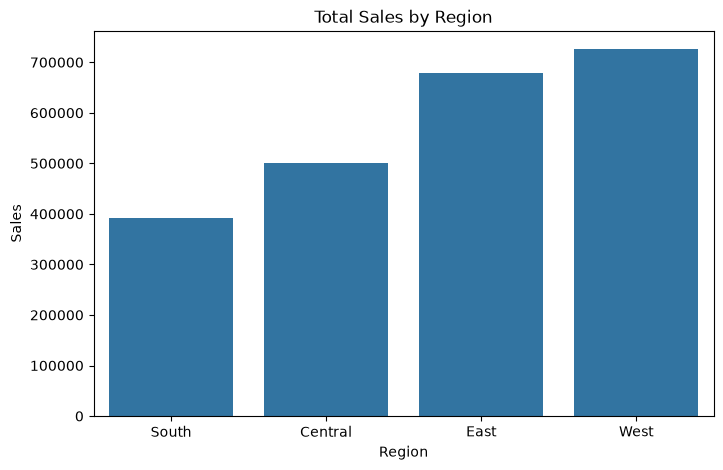
About $390K in sales, nearly half of West, so it is worth asking whether this is demand or market coverage.
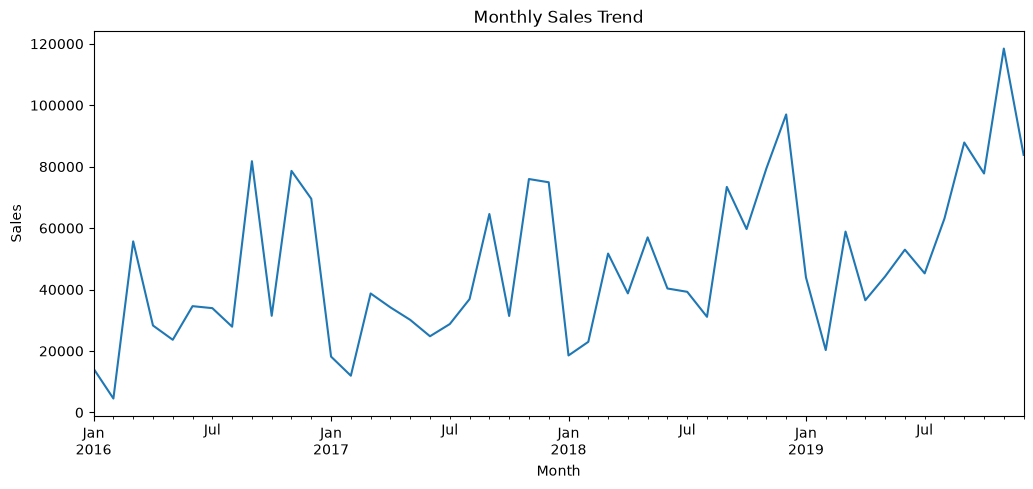
Every year (2016–2019) peaks in Nov/Dec, a predictable pattern.
The largest share of profit (51%) from the smallest share of volume (18%) and a low discount share.
Delivery takes 0–7 days with low variance, and it doesn’t correlate with anything else.
Revisit pricing or cap discounts. This is where the biggest losses sit.
The single largest source of discount-driven loss in the dataset.
Check demand, customer coverage and market access.
High margin with low discounting is the benchmark for other categories.
Prepare inventory and staffing ahead of the recurring year-end peak.